Business Process Improvement:
The Devil’s in the Detail
By Ben B GrahamPresident
The Ben Graham Corporation
© Copyright 2004-2017, The Ben Graham Corporation. All rights reserved.
Links may be established to this paper.
Organizations employ a number of formulas to improve their business operations and get more "bang for their buck". Effective programs invariable get down to an examination, analysis and improvement of the business processes. Using a process flowchart to define the existing system is an essential first step to improvement that is often overlooked or addressed superficially. This article takes a look at a couple of common flowcharting methods being applied today with a focus on the detail process charting methodology that was introduced over sixty years ago.
Organizations are continually reminded of the need to understand their business processes. Governments demand it. Certification Agencies demand it. Auditors demand it. Competition demands it.
People recognize that there is value in understanding the details of the work they do. They know they should understand the mechanics of their processes . They know that understanding their processes will enable them to do a better job. But most people have not been exposed to proven tools and methods and have not learned HOW to study their work. Conscientious people will dig into the details of their work, apply the tools that are available to them and try to figure out how to improve their lot. When a work process is completed by one person, that person may have sufficient understanding of the work to make significant improvements to the way the work is done. On the other hand, when the work a person does is just a part of a larger process, their understanding of their own work and attempts to streamline their piece of the process in a vacuum (without considering the rest of the process) may create more problems than they solve. Over the past twenty-some years, a number of process-focused programs have emerged (Reengineering, BPI, Six Sigma, lean) and evolved. Government mandates (Sarbanes-Oxley, PIPEDA) and Certification Organizations (ISO) have focused on process as well. All of these programs, mandates, certifications suggest process documentation as a starting point.
For nearly a century, people in a position to study work have recognized that a picture of the work flow is an invaluable tool for understanding the work. The first method developed specifically for flowcharting work flow was developed in the early 1900s. It was unveiled to the world in a paper presented the American Society of Mechanical Engineers (ASME) in 1921. In 1947, ASME adopted an evolved version of the flowcharting symbols and method for applying them as a national standard for Process Charting. Since that time, several techniques have been developed or adapted specifically for charting the flow of business or information processes.
Tool or Method?
General Diagramming Packages
There are a lot of tools available that provide symbol sets. But if the symbols are not wrapped in a methodology, then the charter has to invent one. (Collecting the data, stringing the symbols together, handling rework…unusual situations…) The most common tool for drawing flowcharts is the general purpose drawing package. Unfortunately, principal features of these packages, “free form drawing style and many, many symbols” are precisely what make them less suited to documenting business processes. In general, they do not provide the structure to support a specific technique. They typically do provide the symbol sets for various techniques – but no instruction or built-in structure to ensure a technique is applied correctly. Good charts can be prepared with these applications, but it requires an understanding of a flowcharting method along with the discipline to adhere to the method. A lack of consistency in method will usually mean a short life. Many of today's process maps are as much a blueprint for building and understanding procedures and processes as a photograph is a blueprint for developing an automobile. They look clean and streamlined… because they are missing something… the detail of how to get the work done!
Basic Flowcharting
The most recognizable flowcharting method (which includes many variations) is derived from the System & Program Flowcharting method promoted by IBM in the 1960s.
IDEF2
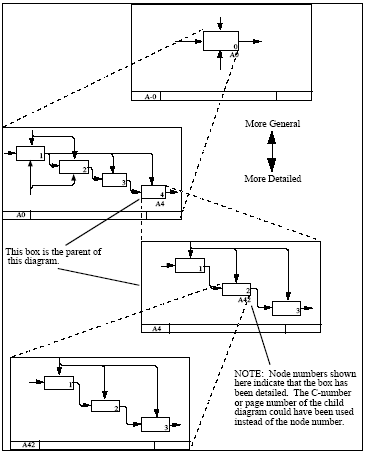
IDEF is a process modeling standard developed by the USAF in the 1970’s and standardized by the Federal Government in 1993. An IDEF0 model consists of a hierarchical series of diagrams, text, and glossary cross-referenced to each other.
The two primary modeling components are functions (represented on a diagram by boxes) and the data and objects that relate to those functions (represented by arrows).
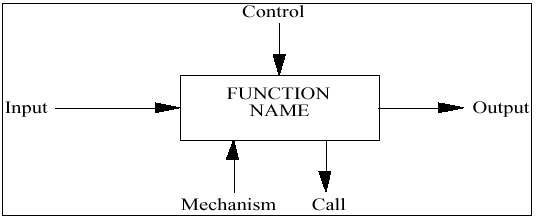
Because the fundamental element of an IDEF process chart is a function, it does not provide clear visibility over delays, it doesn’t provide clear visibility over relationships between documents, it is difficult to see how a piece of the process really fits into the big picture (how a change in one function will impact other areas in the process).
Detail Process Charts3
Information processes include flows of numerous documents, forms, email, systems, parts, people… that are all tied together to accomplish a process objective. Understanding the steps along EACH flow and the relationships between the items is crucial to understanding a process - detail process charts show the steps and the relationships.
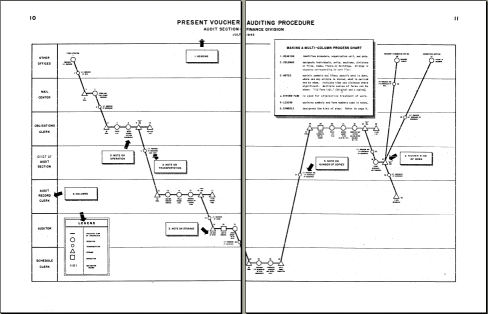
The Detail Process Charting methodology (also known as Graham Process Mapping) was developed by Ben S Graham Sr in the 1940s and is derived from the work simplification Flow Process Charting methodology. The work simplification charting method includes a small, well thought out symbol set and methodology that provides elegant structure to the task of process charting. The fact that the work simplification symbol set was adopted as the ANSI and ASME standards for Process Charting over fifty years ago is testimony to its fundamental simplicity. It has flowed through a half century of new technologies and constantly changing processes with the grace of an alphabet…because it is fundamental. It is basic. It breaks the work down into individual elements to get to the root of our processes. It speaks the language of process.
It is unfortunate that this symbol set (and many others) are included in a number of diagramming packages with little or no instruction on how to apply them correctly.
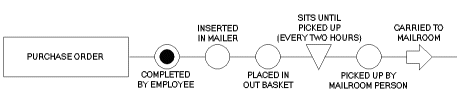
Four basic symbols represent doing work, checking work, moving work from one location to another and nothing happening.
Four additional symbols represent variations of doing work. The four variations of doing work include three variations of value-added work and a symbol representing destruction or termination. The value-added symbols are the Do symbol for manufacturing processes and the Originate and Add/Alter symbols for information processes. That’s it! Eight symbols.
The beauty of this method is its inherent problem-solving format. It breaks down the work to INDIVIDUAL elements. The processing of each item (document, form, letter, log, record, file, email…) is represented as a horizontal line. Charts flow left to right. The name of the item is identified in a label at the beginning of the line and the activities (AND periods of non-activity) that occur are represented with symbols laid along the line in sequence.
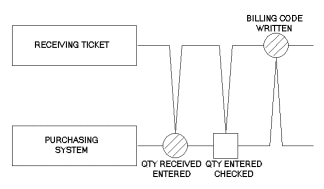
With a multi-flow chart, when the work divides or separates, the chart separates. What had previously been a single flow line becomes multiple flow lines.
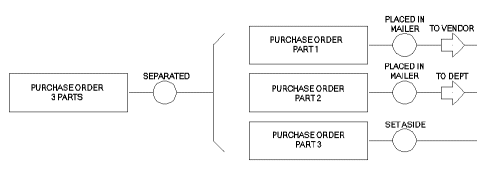
Even at a bird’s-eye view, the number of items in this simple process stands out. Every horizontal line is a different item. Each is identified in the Label at the left end of the line.
The Advantage of Detail Process Charts
Simple, high-level charts can appeal to people who do not want to get into the detail. But, the detail does not go away because it is ignored. If we want to engineer our processes we need the detail. Here are some of the advantages that detailed process charts provide.The Chart Items
With Detail Process Charts, every item in the process is represented as horizontal line beginning with a label. The processing steps occur in sequence along each line. The activities that are represented by the steps are happening TO the item named in the label. This avoids a great deal of confusion and protects us against loose ends that have not been thought through. Single-flow process maps necessarily group many items together in a single step (activity) thereby obscuring the flow and relationships of individual items.
Horizontal Flow - Left to Right
A breakthrough (in the 1940s) that led to our current ability to chart large, complex processes was keeping the lines horizontal, flowing from left to right. Charts that wander make sequence hard to follow. This is the typical nature of single flow process maps. Also, horizontal charts are easy to display, regardless of their size. It is easier to read a chart, whether it is three feet or twenty-three feet in length, if it is horizontal rather than vertical.
Charts Show Actual Work, Not Theory
What is recorded is what actually happens, not what theoretically could or should happen. The data is assembled empirically and the fact that each item has its own line assures that the process will be thought through. An open end of a line begs the question, what happens next.
Non-Value Added Work is Apparent
When people think through a work process without dealing with individual items they tend to focus on the major actions. These are invariably the value-added steps, the things that move the process along to completion. Meanwhile, real world processes usually have eight or ten non-value-added steps (that account for over 90% of the processing time) for every one that adds value. Most other methods don’t distinguish value-added steps or steps of non-activity.
Consistent Knowledge of Location
The arrow symbol identifies every time the location changes. Therefore, it is simple for a person to determine location for every item throughout all of the steps of a workflow. All that is needed is to trace backwards from the step in question to the last arrow.
Document Redundancy is Obvious
When you display the items, redundancy becomes obvious. Where the individual items are not displayed, redundancy is buried in the flow.
Controls Points are Identified
The inspection symbol identifies each time an item is checked to see if it is right. Careful study of Graham Process Maps sometimes reveals costly omissions where inspections that should be conducted are not. Detail Maps also reveal inspections that are completely redundant and unnecessary.
Records Storage and Disposal
Because each item in the process has its own line, the final disposition of each item is apparent. This is a major advantage when it comes to making decisions as to which records must be retained and which can be disposed of. Each item line that displays a record ends with symbols and words that identify disposition.
Detailed Charts Provide a Vehicle for Harnessing Detailed Experience
When experienced people read through a process chart that includes their work, they have no difficulty recognizing their portions and seeing how they fit into the bigger picture. When these people are assembled as a team, they have the appropriate collective knowledge to make informed decisions about the whole process. A by-product of this teamwork is improved cooperation. When teams of people from different areas work together, the team members develop improved understandings of each others work. This tends to diminish interdepartmental disagreements and establishes a forum for creating organizational rather than departmental solutions.
Summary
Good people who understand parts of the process may get some value using high-level charts for improvement. Some modify the method to incorporate genuine detail process symbols (or steps) to denote delay, transportation… This is a testimony to capable people who manage to be successful despite having inadequate or inferior tools. High-level charts may provide enough structure to help an analysis team stay focused on the process and challenge the process blocks in sequence. HOWEVER, the team will have to dig into details to make good decisions about the process. Those same good people would do a better job, more easily with detail process charts.
Detail charts may be intimidating at first glance. However, the chart is a reflection of the process. If the chart is complicated, the process is complicated. If it is a challenge to understand complicated detail process charts, how else will we understand the more complicated processes they represent?
We need to instill into our organizations a discipline to become masters of our processes and not slaves to them. Learning the language of process – detail process charting – will help us get there.
1
Process Charting: It’s use in procedural analysis
(Management Bulletin, Executive Office of the President, Bureau of the Budget, November 1945)
2
Draft Federal Information Processing Standards Publication 183
(1993 December 21)
Announcing the Standard for INTEGRATION DEFINITION FOR FUNCTION MODELING (IDEF0)
3Ben B Graham,
Detail Process Charting: Speaking the Language of Process
(John Wiley & Sons, 2004)