
Understanding Business Processes
By Ben B. GrahamPresident
The Ben Graham Corporation
© Copyright 2004, The Ben Graham Corporation. All rights reserved.
Links may be established to this paper.
Permission is granted to print and distribute this document in its original PDF format.
Process charts provide a baseline for process improvement and are excellent training tools if they include enough detail to support common sense decisions. The Graham Process Mapping (Charting) methodology was initially developed over a half century ago to help people analyze business processes. Graham charts clearly identify the documents in a process… the value-added points where data is manipulated…the reports that are generated and the people involved. With this information at hand, current processes can be analyzed in detail. Graham charts are a solid tool for incremental change and a powerful enhancement to major change efforts – helping improvement teams ensure that real requirements are built into new processes and unnecessary data, flow, work… is kept out.
Read the article below, or provide your name and email to download the pdf...

In 1944, Ben S Graham Sr. attended Allen Mogensen’s Work Simplification Conference in Lake Placid New York. The workshop was an intensive 6-week program that immersed delegates in the philosophy and tools of work simplification. As the only delegate whose background was not in manufacturing, Graham took the work simplification tools and methods back to his employer, The Standard Register Company, and proceeded to adapt them to the study of information processes.
 Ben S. Graham is seated in the middle row in the center of the photograph.
Work simplification is defined as the organized application of common sense to find better and easier ways of doing a job... a logical, orderly approach to the solution of problems used by everyone to eliminate waste - waste in time, energy, space, equipment, materials, waste of any kind. It is a blend of technique and teamwork. The organization is provided by a solid toolset with rigid methodology. The common sense is provided by teams of people who do the work. Work simplification puts the toolset into the hands of the people who are most knowledgeable about the work, thereby tapping into the organization’s most valuable resource – the first-hand experience of its people. Work simplification provides us with the tools and methods to study and understand our business processes.
Simply talking about processes isn’t understanding them. Looking at them from 10,000 feet isn’t going to cut it -- If we read through procedures and talk to the managers and supervisors about the processes, we are gaining an understanding that is at least one step from reality. If we document processes using this information, the documentation will not reflect reality. To understand our processes, we need two things…the right information and a good tool for capturing and displaying process detail.
The right information is in the heads of the PEOPLE WHO DO THE WORK - the people who, day in and day out, are living the process that you want to document. It is the accumulated experience specific to the process that you want to chart. These people know WHAT HAPPENS in their part of the process better than anyone else because it is what they do. They know what appears to make sense in the process and what appears to be nonsense in the process. They know how to make their piece of the process work and how to get around it when it doesn’t work.
The right tool should provide clarity without being overly simplistic. It should provide detail without clutter. It should be easy to use and easy to understand. There are a lot of flowcharting tools that provide symbol sets. But if the symbols are not wrapped in a methodology, then the charter has to invent one. (Collecting the data, stringing the symbols together, handling rework…unusual situations…) Fortunately, the work simplification charting method has made this easy with a small, well thought out symbol set and methodology that provides elegant structure to the ominous task of process charting. The fact that the work simplification symbol set was adopted as the ANSI and ASME standards for Process Charting fifty years ago is testimony to its fundamental simplicity. It has flowed through a half century of new technologies and constantly changing processes with the grace of an alphabet…because it is fundamental. It is basic. It gets to the root of our processes. It speaks the language of process.
Process Chart Format
Graham process charts flow left to right. They display all of the major items in a process. An item is always something physical. It is something you can see. This includes electronic files, email, documents, diskettes, CDs, databases, log books, reference books, etc. Each Item is charted as a separate flow line that is identified with a label at the beginning of the line.
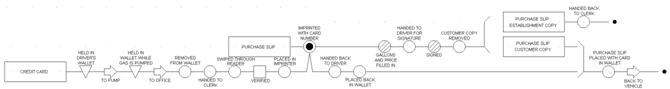
Figure 1 shows the horizontal nature of a Graham Process Map. Even at this tiny scale, it is clear (Look for the Labels at the beginning of each line) that there are 15 different items involved in this process including one item that is separated into four items. Most charting methodologies do not come close to providing this level of detail in a single picture. The point of process flowcharting is to provide a visual representation of the process including each item in the process.
Figure 1: Horizontal flow of a detail process chart.
Process charts show the interrelated flows of many items with a “vee-shaped” conventions called Effects. Relationships between items “tie” the pieces of the process (all the different items) together. These relationships show when information on one item is used to cause something to happen to another item.
Brackets show when items are combined or separated. When a four-part form is separated into four individual items, an opening bracket is used to show a single flow line splitting into four separate flow lines. Each of the four new flow lines begins with a label for identification.
Figure 2 shows a section of a chart that includes a number of different items involved in a patenting process. New process lines are introduced when the Patent Database is accessed, when the International Instruction Sheet is printed from the Patent database, and when the Activities Screen is displayed. A new line is also introduced for the International Application Cover Sheet that is created. Every line begins with a Label. Every action that occurs on an item line is happening to the item identified in the Label. All the items are tied together with Effects – The receipt of the Docket folder causes the Patents Database to be accessed and the docket number that is entered comes from the docket folder…
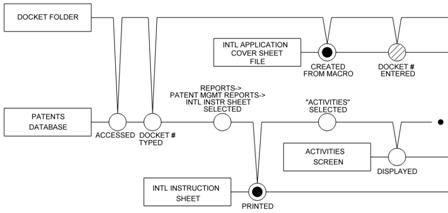
Figure 2: A Label Identifies Each Item.
Symbols
Actions and non-action steps are indicated by symbols laid out in sequence along each flow line. Each symbol includes a few words to complete the description of what is happening to the item at that step. Periods of non-activity are captured using the Delay symbol. Process charts, display what people do, step by step, to the items in a process. The flow lines represent the items and the symbols represent the actions. Each item is distinct and each step is distinct so there is little confusion about just what is happening at every point in the process.
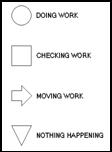
Four basic symbols represent doing work (the Handle symbol), checking work (the Inspection symbol), moving work from one location to another (the Transportation symbol) and nothing happening (the Delay/Storage symbol).
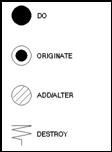
Four additional symbols represent variations of doing work. The four variations of doing work include three variations of value-added work and a symbol representing destruction or termination. The value-added symbols are the Do symbol for manufacturing processes and the Originate and Add/Alter symbols for information processes. That’s it! Eight symbols.
This outstanding set is analogous to an alphabet or number system. The symbols are mutually exclusive, comprehensive and universally applicable.
Conventions
The word "Convention" refers to the conventional ways to label and draw the lines that connect the Symbols. There are also conventions that don’t relate directly to the process flow, but simply provide clarity to the chart.Label and Line
A basic process flow is represented with a horizontal line beginning with a Label.
The line is drawn left to right to display flow. The reader follows the movement of items through a process by reading the chart from left to right. Labels identify the items that flow through the process.
Documenting a process almost always requires charting the flow of more than one item. The following Conventions show interrelationships between multiple flow lines:
Effect
An effect shows a relationship between two items. One item provides information that causes something to happen to the other item.
Brackets
Brackets show the physical gathering or separating of multiple items. They may also be used to show logical groupings of multiple items through alternative processing paths. Opening Brackets show the separation of items. Closing Brackets show the gathering of items.
The following Conventions are used in individual flow lines:
Alternative
Sometimes an item reaches a point in the process where a decision must be made and the item will include the information needed to determine which path to follow. That point in the process is called a Decision Point. It is displayed as a small, solid black circle and always has two or more alternative paths continuing out of it to the right.
Correction/Rejection
A Correction or Rejection is a special case of alternative that follows an inspection and is represented with a dotted line.
Rejoin
A Rejoin simply brings alternative paths back into a single line.
The following Conventions are features that add clarity to a chart:
Connector Label
A Connector Label at the end of a line is called a Go-to Connector and indicates that processing continues either on another chart or somewhere on the same chart. The Go-to Connector references a Target Connector. The Target Connector is typically at the beginning of a short line segment that uses a Rejoin into another line to show where the processing continues.
Stop/Start
A Stop/Start is used to indicate a section of processing that has been intentionally left out of a chart.
Period
A Period is used on process lines the same way that it is used in a sentence; it marks the end of the line.
Bypass
A Bypass is used to eliminate confusion at crossed lines.
The label is the subject and the symbols are verbs - the actions. The process chart speaks the language of process. All we need are a few words of plain language text associated with each Label, Symbol and Alternative branch and ANYBODY can read it!
Choosing the right words
With just a few words associated with each symbol, the reader can understand what is happening, where the work is occurring, who is doing the work and how long it takes to complete. The right words are presented by answering a few basic questions. Basic journalism classes teach that to write a complete story you need to answer a specific set of questions. The questions are often expressed in an order that seems to roll off the tongue naturally – who, what, when, where, why and how. These are the same questions that are used in defining and analyzing business processes, but they are not treated equally. In defining a process (developing the as-is chart), the most important question to answer is ‘what is happening?’ The next set of questions are also important – ‘Who does the work? Where is it done? And When is it done?’ Detail as to how the work is done is not as important and the question ‘Why is this step done?’ should be avoided during data collection.
Gathering the Facts
Armed with a clipboard, a pencil and familiarity with the process symbols and conventions, you go to the work location and observe the process. Always gather data from the person who is the top authority in the organization with respect to that data, that is, the person doing the work, and treat that person with the respect due a top authority.
Walk the path that each process follows - with a clipboard in hand- Observe more than one work cycle and worker when applicable - but don't try to chart every variation
- Represent a NORMAL work cycle
- Work quickly - use the charting Symbols as a note taking shorthand
- Be methodical - follow and list steps in order
- Don't trust detail to memory, write it down
- Clarify uncertainties - err to the side of too much information
- Be accurate and legible - so the data can be audited/reviewed
- Don't look for faults
- Once charted, walk the path again for verification
- Respect work schedules and job-related interruptions
- Assume the role of fact finder - the people are the experts
- Make sure people understand what you are doing and why they are involved - because they are the experts
- Observe & interview the people who do the work, not managers
- Observe & interview at the work area
- Get facts primarily from observation - people can usually show you faster than they can describe
- Demonstration is much closer to reality than words
- Stick to simply identifying steps and avoid detail of how steps are performed - this saves an enormous amount of time
- Note WHAT is done at each step
- Note WHERE the work is located at the start of the process and with each transportation note where it goes
- Note WHEN the process begins and the amount of time with each delay as well as any other time-consuming steps
- Note WHO is doing the work each time the person doing the work changes
- Avoid getting into detail of HOW each step is performed -- answers to the other questions provide us with enough detail to identify the steps for analysis. For most activities, HOW is implied (written with a pen, keyed on a keyboard…) by the activity and the item (Label) involved. In some cases, HOW can fill pages and still not be adequate (a doctor completing a patient’s record). In these cases, whatever detail is needed is acquired during analysis by having the "doctor" present.
- Save WHY for analysis
- Chart the items of the process as horizontal lines
- Each item line begins with a Label for identification
- Each work step is identified by a Symbol that represents what happens to the item at that point in the process
- The Symbols appear in sequence along the item lines
Example - Credit Card "Pay at the Counter" Process
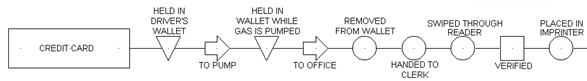
With a clipboard in hand, follow the credit card through the process.
The vehicle pulls up to the pump. The credit card is in the driver's wallet. The driver gets out of the vehicle and walks over to the pump. The card continues to sit in the driver's wallet while the gas is pumped. After the gas is pumped, the driver walks to the office and removes the credit card from the wallet. The driver hands the card over to the station clerk who swipes it through a reader. The credit card is verified by the card reader. The card is place with a purchase slip on an imprinter and an imprint of the card is made on a purchase slip. The card is handed back to the driver who places it back in the wallet. The purchase slip is filled in by the clerk, and then handed to the driver for signature. The driver signs the purchase slip, removes the customer copy and hands the establishment copy back to the clerk. The driver places the customer copy of the purchase slip in the wallet, returns to the vehicle and drives away.
The following table represents the notes that would be captured during observation…
| OBSERVATION | Credit Card | Other Items |
| The vehicle pulls up to the pump. The credit card is in the driver's wallet. |
|
|
| The driver gets out of the vehicle and walks over to the pump. |
|
|
| The card continues to sit in the wallet while the gas is pumped |
|
|
| After the gas is pumped, the driver walks to the office. |
|
|
| The driver removes the credit card from the wallet. |
|
|
| The driver hands the card over to the station clerk. |
|
|
| The card is swiped through a reader by the clerk. |
|
|
| The credit card is verified by the card reader. |
|
|
| The card is place with a purchase slip on an imprinter. |
|
|
| An imprint of the card is made on the purchase slip. |
|
|
| The card is handed back to the driver. |
|
|
| The driver replaces the card in the wallet. The purchase slip is filled in by the clerk. |
|
|
| The purchase slip is handed to the driver for signature. |
|
|
| The driver signs the purchase slip. |
|
|
| The driver removes the customer copy of the purchase slip. |
|
|
| The driver hands the merchant copy back to the clerk. |
|
|
| The driver places the customer copy of the purchase slip in the wallet. |
|
|
| The driver returns to the vehicle and drives away. |
|
|
Begin the chart with a label that identifies the item.
Add the symbols, left to right, in the order they occur.
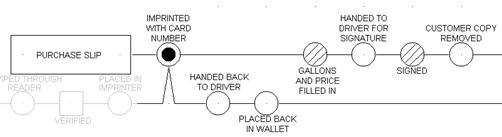
When a second item, the purchase slip, is introduced in the process, a second Label is drawn and a second line is begun. The Credit Card line (below the Purchase Slip line) provides the first transaction information to the Purchase Slip (the card number and detail that is imprinted on the Slip)…so there is an effect from the Credit Card line into an origination symbol on the Purchase Slip line. The Credit Card provides information that is used to prepare a Purchase Slip.
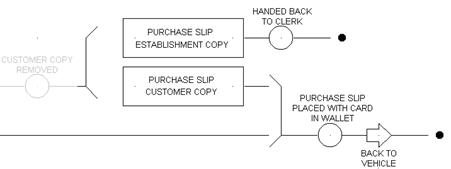
…and when the purchase slip is separated into two parts, the purchase slip line separated into two lines (with an opening bracket) and both lines start with a Label. The Labels no longer just identify the purchase slip, but identify the specific parts of the purchase slip (Establishment Copy and Customer Copy). The Customer Copy is placed with the Credit Card (the bottom line) in the wallet (with a closing bracket) and they continue through the process together as a single line.
Managing Our Processes
As we chart more and more processes, we need to consider how we are going to manage our processes and our process charts. A process chart library will help us:
- provide business process transparency
- satisfy regulatory requirements (Sarbanes-Oxley)
- satisfy certification requirements (ISO)
- support audits
and will serve as a foundation for continuous improvement.
For a Process Library and continuous improvement program to survive, they must be incorporated into the business culture and become a way of life. This requires genuine support and encouragement from management, real perceived value in the minds of the operating people and solid training with clear expectation. When the work makes sense and the people understand what they are contributing to the organization, attitudes tend to be upbeat and innovation thrives. Good training can contribute to a good process library and a good process library can help build a good training program, so let’s nudge the momentum in that direction!
Fundamental roots of system management can be traced back nearly 2500 years when Confucius offered the following insights…
'Man can make System great. It isn't System that makes man great."
"To expect accomplishment without proper advisement is ridiculous."
Ben B. Graham is President of The Ben Graham Corporation and author of the books "The Process Improvement Project Guide" and “Detail Process Charting: Speaking the Language of Process”. The Ben Graham Corporation pioneered the study of business processes and has provided training and consulting services in business process improvement methods since 1953. The Ben Graham Corporation publishes Graham Process Mapping Software, designed specifically for preparing detailed process maps. More information about the software is available at http://www.processchart.com